B2B buyer research in 2026 is overwhelmingly self-directed and AI-assisted: 67% of buyers now prefer a rep-free experience, and buyers complete a median of 28 research touches before contacting a seller. Buying committees have grown, and pricing transparency now shapes who make the shortlist at all. The single priority for this quarter is auditing where your brand shows up in AI-assisted research and how clearly you signal price.
Most B2B research is now self-directed and AI-assisted, with 45% of buyers using AI during recent purchases and a median of 28 touches before contact.
Buyers form shorter, private shortlists early in the process, making early-stage content and AI visibility crucial for inclusion in their decision.
Committees have expanded to an average of 14.4 stakeholders, each entering the process at different times with distinct evidence needs.
Visible, modular content that provides clear proof points and role-specific information significantly improves credibility and shorten deal cycles.
Vendors should focus on auditing AI search appearances, publishing transparent pricing, and building role-specific assets to adapt to the evolving research landscape.
Headline trends shaping B2B buyer research
Three shifts define the current research landscape, and each one has direct implications for how insight and marketing teams allocate budget.
AI is now a research channel, not a novelty: 45% of B2B buyers report using AI during a recent purchase, according to Gartner's 2026 sales survey.
Research touches have multiplied: buyers complete a median of 28 self-directed touches before any sales conversation, per the Visionary Marketing 2026 study.
Shortlists are forming earlier and more privately: with most research happening before contact, vendors absent from early-stage channels are often excluded before a seller ever learns a deal existed.
67% of B2B buyers now prefer a rep-free purchase experience, Gartner reports. That preference, paired with 28 median research touches, means most of the buying decision is effectively made before a salesperson is involved.
For insight and marketing leaders, this reframes the brief. The job is no longer to support a sales-led funnel; it is to make sure the brand performs well in channels the sales team never sees. That means auditing AI assistant outputs, review platforms and content libraries with the same rigour previously reserved for the sales deck.
How buyers research: channels, content and the new role of AI
Self-directed research spreads across a wider channel mix than most B2B marketing plans account for. AI assistants now account for roughly a third of all research touches, 34% according to Visionary Marketing’s analysis, alongside content downloads, peer community discussions, review platforms and direct vendor site visits.
AI assistant queries: buyers ask tools directly for vendor recommendations and comparisons, often before visiting a single vendor website.
Review platforms and peer forums: used to validate claims made in vendor content, particularly at the shortlist stage.
Modular content assets: case studies, pricing pages and ROI calculators that answer a specific question rather than a general pitch.
Direct vendor sites: visited later in the process, often to confirm detail rather than to discover options.
Forty-two percent of buyers say AI-surfaced vendor recommendations directly shaped their shortlist, which means content written only for human search no longer covers the full research journey. Gartner’s guidance points the same way: structure content into modular, agent-ready building blocks rather than long-form collateral that assumes a single reader working through it in order.
Pro Tip:Test your own category queries in two or three AI assistants each quarter and note whether your brand appears, and in what context.
Buying committees: composition, timing and gating roles
Committees have grown larger and more structured, and that changes how evidence needs to be sequenced. The average B2B buying committee runs to 14.4 stakeholders for deals in the $100,000 to $500,000 range, according to Visionary Marketing’s 2026 study, based on an analysis of 184 CRM client cohorts and surveys of 900 buyers and 900 sellers.
Each role tends to enter the process at a different point and asks a different question of the evidence in front of them.
Champion: enters early, needs clear differentiation and proof the problem is worth solving now.
Economic buyer: enters mid-process, wants cost justification and risk mitigation.
Technical or security reviewer: gates later-stage progress, needs detail that general marketing content rarely provides.
Procurement and legal: enter last, focused on terms, pricing structure and compliance.
The practical implication is evidence mapping: build content for each role’s entry point rather than one asset meant to serve the whole committee. A single case study cannot do the job of four different gates.
Trust and expertise: the content that convinces in self-directed journeys
When research happens without a seller present, credibility signals carry more of the persuasive weight that a sales conversation used to carry. Peer validation, named expertise and visible proof points now do work that generic brand messaging cannot.
Case studies with named outcomes: specific results outperform general claims, particularly when cited by AI assistants summarising vendor options.
Third-party review presence: buyers cross-check vendor claims against independent platforms before taking a meeting.
Modular, question-led assets: content built to answer one buyer question (pricing, implementation time, integration risk) performs better in AI-assisted research than long-form brochures.
Vendors absent from AI assistant responses risk being excluded from shortlists entirely, a pattern the Visionary Marketing study flags as a growing commercial risk rather than a marketing inconvenience. Static PDFs built around a single narrative arc struggle here, because they cannot be parsed and re-served by an AI assistant answering a narrow, specific query. Breaking content into discrete, well-labelled modules, FAQ-style content, comparison tables, pricing explainers, solves this more reliably than a longer document ever could.
Pricing transparency, pilots and procurement
Visible pricing is no longer a minor preference; it is a measurable commercial lever. 87% of buyers want pricing visible before first contact, and vendors who publish transparent pricing see median time to close fall from 38 days to 22 days, according to the Visionary Marketing 2026 study.
Publish indicative pricing wherever the commercial model allows it, even as ranges, to avoid early-stage exclusion from shortlists.
Reserve bespoke quoting for genuinely complex deals, where pricing depends heavily on scope.
Use proof-of-concept stages for larger deals where technical risk, not price, is the real objection.
For most mid-market deals, the cycle-time gain from visible pricing outweighs the perceived risk of competitive exposure. Where a proof-of-concept is warranted, keep it scoped to a specific, measurable outcome rather than an open-ended trial.
What sales and enablement must change now
Sales enablement built for a seller-led process no longer matches how committees actually move. Content needs to work whether a rep is in the room or not, and scoring models need to catch up with how research actually spreads across a buying group.
Build agent-ready content modules: short, self-contained assets a buyer or an AI assistant can use without a seller walking them through it.
Shift from lead scoring to account-level engagement scoring: tracking a single contact's activity misses the committee-wide pattern that now drives most deals.
Equip reps for rep-assisted moments specifically: the 33% of buyers who still want seller involvement need a different kind of conversation than a discovery call.
Pro Tip:Review your last ten closed-won deals and count how many distinct stakeholders engaged with content before the first sales call; it is usually more than your CRM shows.
Over the next 90 days, prioritise rebuilding your highest-traffic asset (often a pricing page or flagship case study) into modular, role-specific sections, and set up account-level scoring even as an interim manual process.
Skopos practitioner’s playbook: research methods, KPIs and a 90-day diagnostic
Validating these trends for your own category takes a hybrid approach rather than a single survey wave. Combining CRM cohort analysis with buyer surveys and qualitative interviews gives a more honest picture than any one method alone.
Pull won and lost deal cohorts from CRM data to map how many touches and stakeholders were actually involved.
Run a short buyer survey asking directly about research channels used, pricing expectations and committee composition.
Validate with 8 to 10 qualitative interviews to surface the reasoning behind the numbers, particularly around risk and trust.
Set KPIs around research-touch count, AI-channel visibility and account-level engagement, not just lead volume.
Pro Tip:Ask one simple survey question, “did pricing visibility affect your decision to engage with this vendor,” and track the answer over time.
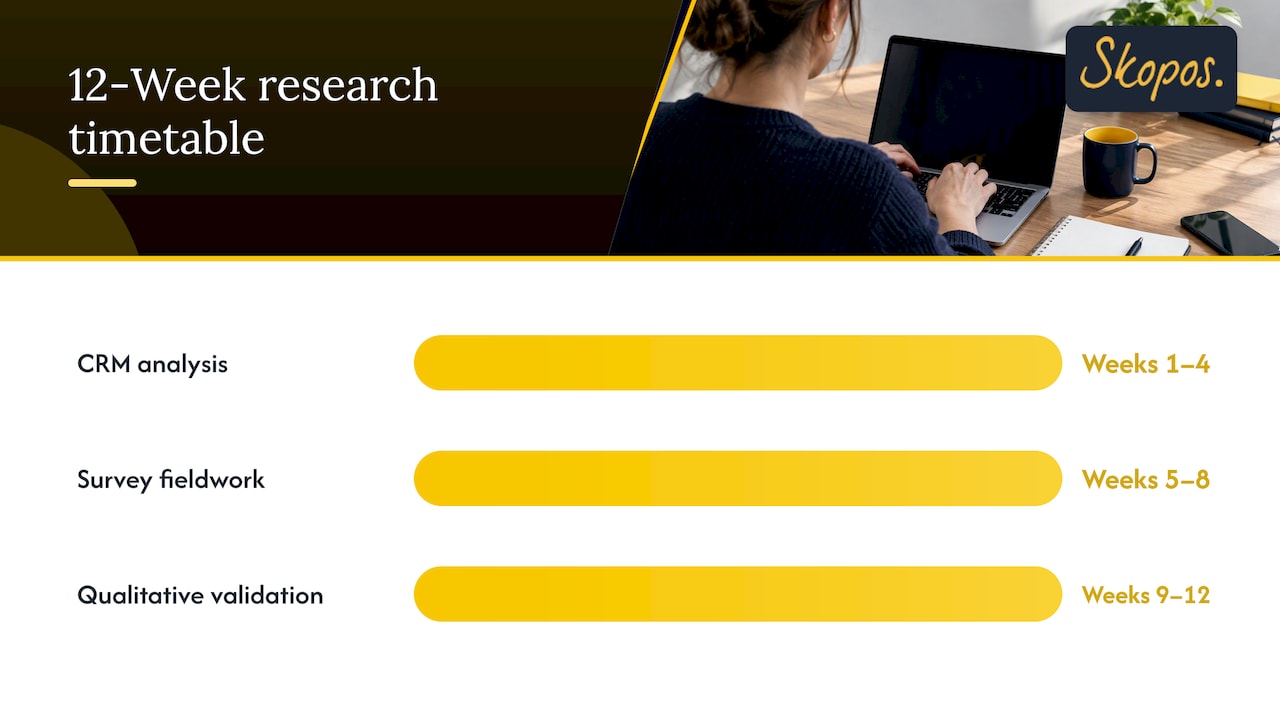
A realistic timetable runs insight ownership of CRM analysis in weeks one to four, survey fieldwork in weeks five to eight, and qualitative validation with a joint insight and sales readout by week twelve. Our B2B and B2C research work typically follows a similar structure, adapted to the client’s existing data maturity.
Action checklist: six priority moves for the next quarter
A short list of priorities helps keep this manageable rather than overwhelming the next planning cycle.
Audit AI assistant visibility for your core category terms (quick win, insight team, two weeks).
Publish or clarify pricing signals on your highest-traffic page (quick win, marketing, two weeks).
Rebuild one flagship asset into modular, role-specific content (project, content team, six weeks).
Pilot account-level engagement scoring on one product line (project, revenue operations, eight weeks).
Map evidence needs by committee role for your top deal size band (project, insight, four weeks).
Survey recent buyers on research channels used to validate your own touch count (project, insight, six weeks).
Impact of mobile and remote work on B2B buyer research behaviours
Remote and hybrid work patterns have changed when and how B2B research happens, spreading it across fragmented moments rather than concentrated desk sessions. Buyers now research on mobile devices between meetings, during commutes or from home offices, which pushes demand toward shorter, scannable content over long-form documents best suited to a desktop read.
This fragmentation reinforces the shift toward modular content. A stakeholder scrolling a case study on a phone during a short break needs the headline result and a clear next step within the first screen, not a multi-page narrative that assumes uninterrupted attention. Pricing pages, comparison tables and FAQ-style content tend to survive this fragmented attention pattern better than dense whitepapers.
Remote work has also decentralised buying committees geographically, meaning stakeholders rarely sit in the same room to discuss a vendor together. Much of the internal debate that used to happen face to face now happens asynchronously, over shared documents, Slack threads or forwarded links, which raises the value of content designed to be shared and understood without a presenter walking the room through it.
For insight and marketing teams, this means testing content not just for clarity but for how it performs when skimmed on a small screen and forwarded without context. A pricing page or case study that only makes sense with a verbal introduction will lose influence in this kind of distributed, asynchronous review process.
Using data analytics and intent data to predict buyer research stages
Intent data and behavioural analytics have become central to tracking where a buying committee actually sits, given how much research now happens before a seller is ever contacted. Website visit patterns, content download sequences and third-party intent signals (firmographic and topic-level data purchased from intent providers) offer a proxy for activity that used to be invisible until a lead form was submitted.
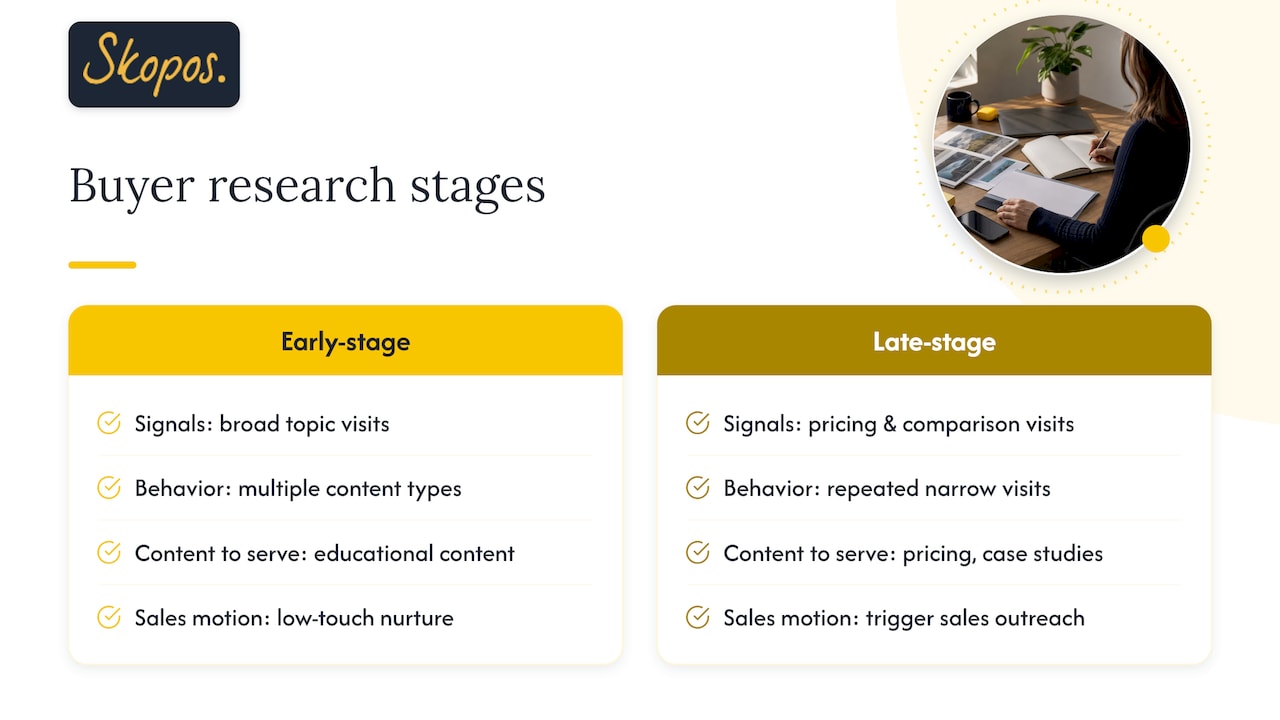
The practical use case is sequencing, not just scoring. Rather than treating every engaged account the same, analytics can show whether a committee is still in early-stage discovery (broad topic research, multiple content types) or late-stage validation (pricing pages, comparison content, repeated visits from a narrower set of job titles). That distinction should drive which content gets surfaced next, and which sales motion, if any, gets triggered.
Account-level engagement scoring, built from this kind of aggregated behavioural data, generally gives a more accurate pipeline forecast than individual lead scores, since it reflects how a whole committee is moving rather than one contact’s activity. Building this doesn’t require an enterprise platform from day one; even a manually maintained account engagement sheet, updated from CRM and web analytics exports, improves forecasting accuracy over single-lead tracking.
The risk is over-reliance on activity volume as a proxy for intent. A spike in page views can mean genuine buying interest or a single stakeholder doing competitive benchmarking with no budget behind it, which is why analytics should inform, rather than replace, direct buyer research.
Challenges B2B buyers face during research and how they overcome them
Buyers researching B2B purchases in 2026 face a genuine information problem: more available content, more vendors to evaluate, and less time to work through it all before committee deadlines. Three recurring challenges stand out.
The first is verification fatigue: with so much vendor-produced content available, buyers increasingly discount claims unless they can be cross-checked against independent sources. This is part of why review platforms and peer communities have grown in influence, buyers use them specifically to validate what vendors say about themselves.
The second is committee coordination: with an average of 14.4 stakeholders involved in mid-sized deals, reaching internal consensus is often harder than evaluating any single vendor. Buyers tend to solve this by appointing an informal internal champion who consolidates research and presents a shortlist to the wider group, rather than having every stakeholder evaluate every option independently.
The third is pricing ambiguity: when pricing isn’t visible, buyers often spend disproportionate research time trying to estimate cost before deciding whether a vendor conversation is worth having at all. This is a direct driver behind the demand for visible pricing noted earlier; it isn’t a preference for convenience so much as a way to avoid wasted research effort.
Vendors who make independent validation easy (clear review presence), reduce committee friction (role-specific content), and remove pricing ambiguity (published ranges) are, in effect, solving the buyer’s research problem for them, which tends to show up as faster, smoother progression toward a shortlist.
Differences in buyer research processes across industries and company sizes
Research behaviour scales with deal complexity and risk more than with industry labels alone. A $20,000 software subscription and a $400,000 enterprise platform decision involve very different research intensity, even within the same sector.
Smaller deals, those closer to a single-stakeholder or small-team decision, tend to compress the research process: fewer touches, a shorter committee chain, and a higher tolerance for self-service trials or transparent online pricing to close the loop quickly. Larger deals, particularly in the $100,000 to $500,000 range tracked by Visionary Marketing, involve the fuller 14.4-stakeholder committee pattern, longer research cycles and a heavier reliance on proof-of-concept stages before commitment.
Regulated industries, financial services, healthcare and public sector among them, add compliance and procurement layers that extend research timelines regardless of deal size, since legal and security review becomes a mandatory gate rather than an optional check. Technology and consumer brand categories, by contrast, often see faster research cycles where peer review and community discussion substitute for formal procurement processes.
For insight and marketing teams working across sectors or company sizes, this argues against a single generic buyer journey model. Evidence mapping by committee role, discussed earlier, should be adapted by deal size and sector risk profile rather than applied uniformly, since a founder-led small business and a regulated enterprise buyer are, functionally, running different research processes even when evaluating similar categories of product.
Role of emotional factors and risk aversion in B2B buying decisions
B2B buying is frequently described as rational and spreadsheet-driven, but risk aversion is, in practice, an emotional driver as much as a financial one. Buyers are rarely optimising purely for the best outcome; they are often optimising to avoid being the person whose vendor choice went wrong.
This shows up most clearly in the preference for proof, peer validation, named case studies, visible pricing, review platform presence, all of which function as reassurance as much as information. A stakeholder forwarding a vendor’s case study internally isn’t just sharing data; they are building a defensible case that reduces their own personal risk if the decision is questioned later.
Risk aversion also explains some of the committee growth discussed earlier. Involving more stakeholders spreads accountability for the decision across more people, which feels protective even when it slows the process down. Procurement and legal gates, often the last stage in the research sequence, exist partly to formalise that risk-sharing before signature.
For content and messaging, this means that confidence and certainty often matter as much as features. Content that clearly answers “what happens if this goes wrong” (implementation support, guarantees, named support contacts) tends to carry disproportionate influence relative to its length, because it speaks directly to the emotional core of the decision rather than its technical merits.
What this shift means for insight practice
Most of the commentary on AI-assisted buying treats it as a marketing technology story. It is really a measurement story: the committees, touches and channels described here have always existed in some form, but we could not see them properly until CRM data, surveys and AI-visibility tracking matured enough to make them countable.
The organisations that will do well this year are not necessarily the ones with the most content, but the ones willing to measure research behaviour directly rather than inferring it from sales pipeline data alone. That is the gap our human-led, AI-disciplined approach is built to close: using modern tools to see the pattern clearly, then applying judgement to decide what it actually means for strategy.
How we can help you diagnose and act on this
We run the kind of hybrid research, CRM cohort analysis, buyer surveys and qualitative validation, described above as a structured engagement rather than a one-off project. Whether the priority is understanding your buying committee, testing pricing perception or auditing AI-search visibility, our Foundation, Growth and Strategic insight partner plans are built to fit the scope of work required.
Pricing and value perception studies to test whether visible pricing would improve your win rate.
Customer segmentation to map committee roles and tailor evidence by stakeholder.
AI-search visibility work, done in partnership with Betterpresence, to check how your brand appears in AI-assisted research.
Get in touch to scope a diagnostic through our insight partner programme and bring senior-led analysis to your next quarter’s planning.
FAQ
What are the three main types of B2B buyers?
B2B buying committees typically include three broad groups: champions who advocate internally for a solution, economic buyers who control budget and risk sign-off, and technical or procurement reviewers who oversee compliance and implementation details. Real committees often split these further, but these three functions appear in most B2B purchase decisions.
What is the rule of 7 in B2B?
The “rule of 7” is a long-standing marketing idea suggesting multiple exposures to a message before acting on it; it predates the AI-assisted research era described in this article. Current research on B2B buying suggests the relevant figure today is research touches rather than brand exposures, with buyers completing a median of 28 self-directed touches before contacting a vendor.
Is it true that 75% of B2B buyers use social media to make purchasing decisions?
We have not seen a sourced figure supporting that specific statistic. What current research does show is that 34% of B2B research touches now involve AI assistant queries, and peer platforms and review sites play a growing role in how buyers validate vendor claims.
Is B2B business still good in 2026?
B2B remains a substantial commercial category, though the research and buying process has changed considerably: committees average 14.4 stakeholders for $100,000 to $500,000 deals, and 67% of buyers now prefer a rep-free experience. Vendors who adapt their content and pricing transparency to this self-directed pattern are generally better positioned to convert the research happening without them in the room.