

October 15, 2026

10
min read
B2B Survey Response Rates: Why One Benchmark Misleads
Discover what makes a good B2B survey response rate, how to improve participation and why accurate measurement matters for reliable research.

Discover what makes a good B2B survey response rate, how to improve participation and why accurate measurement matters for reliable research.

A realistic benchmark for B2B survey response rates varies substantially with mode and sample frame. The highest leverage actions are a clean, validated contact list, a genuinely concise questionnaire and two reminders, including one sent close to the survey’s closing date. We recommend calculating final rates with a recognised standard such as AAPOR’s RR3 formula so results can be compared and defended
Quoting one number as “the” B2B response rate does more harm than good. Response rates for business surveys vary widely, reflecting real differences in mode, sampling frame and respondent seniority rather than inconsistent execution. A recent review of response-rate expectations found that reasonable targets vary by recruitment method and population, and that the definitions used to calculate “response rate” themselves differ across studies, which makes cross-survey comparison risky without a shared standard.
Several factors explain why programmes using broadly similar methods can achieve very different response rates:
A high response rate also does not guarantee an unbiased sample. Two surveys with identical rates can carry very different risks of nonresponse bias depending on who opted in and who stayed silent, which is why percentile framing matters more than chasing a single headline figure.
At its simplest, a response rate is the number of completed interviews divided by the number of eligible invitees. In practice that simple fraction breaks down quickly: what counts as “complete” when a respondent stops halfway, and what happens to contacts whose eligibility was never confirmed?
AAPOR’s Standard Definitions resolve this with six formally defined response-rate formulas, of which RR3 is widely used in business and web surveys because it adjusts the denominator for an estimated proportion of unknown-eligibility cases rather than assuming they are all eligible or all ineligible. Using a named, documented formula such as RR3 is what allows a reported rate to be checked and compared rather than taken on trust.
Underpinning RR3 is a system of final disposition codes: every sampled case is coded as a complete, partial, refusal, non-contact, ineligible or unknown-eligibility outcome. Minimal disclosure practice calls for reporting these counts alongside the field period and the number of reminders sent, so anyone reviewing the results can reconstruct how the rate was derived.
B2B programmes rarely reach the participation levels seen in consumer research, and the reasons are structural rather than a sign of poor execution.
Recognising which of these factors applies to a given programme is the first diagnostic step before assuming the questionnaire or incentive is at fault. A programme surveying senior IT buyers through a web-only panel is working against at least three of these headwinds at once, and that context should shape expectations before fieldwork even starts.
Not every tactic deserves equal attention. Some interventions are backed by controlled evidence, others are good practice without the same proof, and the most useful playbook ranks them by expected impact against effort.
Pro Tip: Schedule the last-minute reminder for exactly two days before closure. That timing is what the underlying experiment tested, and shifting it earlier dilutes the effect.
The reminder finding deserves particular weight because it is one of the few B2B-specific interventions with a controlled before-and-after comparison behind it, rather than general survey folklore. Incentives are useful, but the same body of research warns that an incentive which raises the count can simultaneously shift the composition of who answers, so the honest approach is to test it, not assume it works in your favour.
Good design decisions cost nothing extra to implement and compound with the reminder and incentive tactics above.
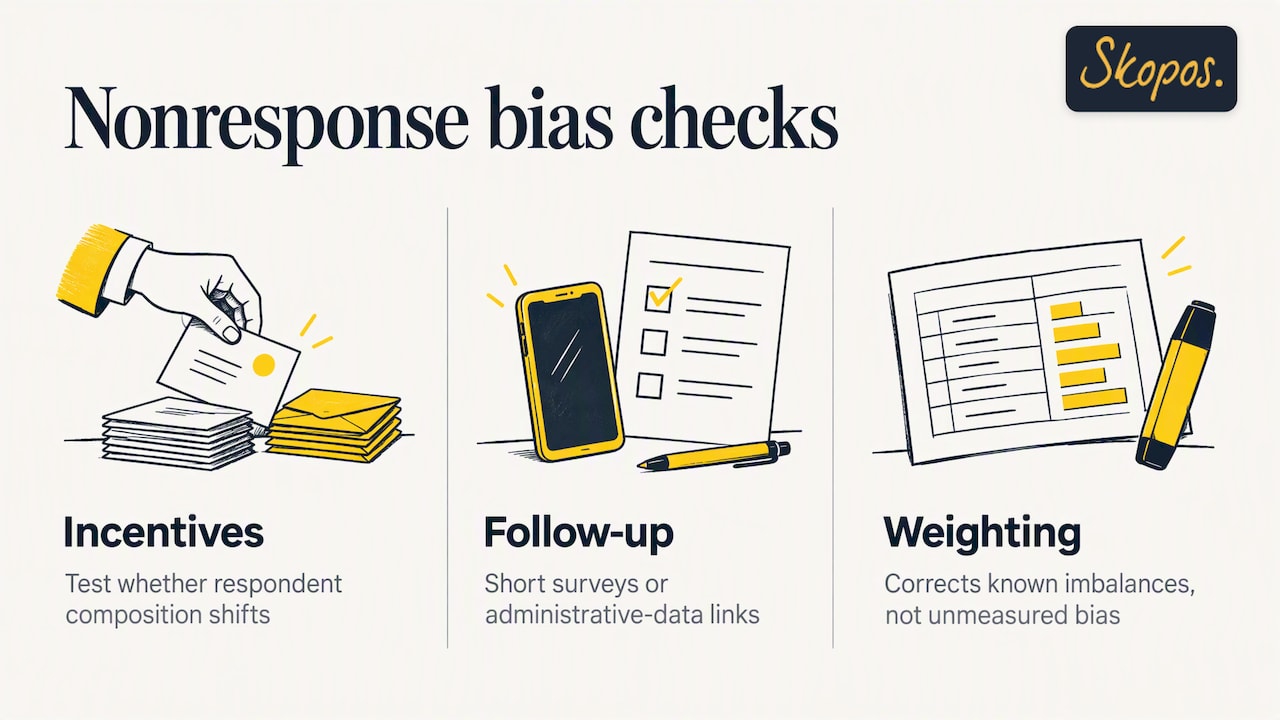
A low response rate is a fieldwork statistic, not proof of a flawed dataset. Methodological reviewers are clear that the question that matters is whether non-responders differ systematically from responders on the things the survey measures, not simply how many people responded.
Randomised incentive designs are one of the stronger tools for testing this directly: by varying the incentive across random subgroups, researchers can observe whether the composition of respondents shifts as participation rises, which is a more rigorous test than simply comparing demographics against a benchmark. Short follow-up surveys with non-respondents, or linking to administrative data where it exists, can serve the same purpose on a smaller budget. Standard post-survey weighting helps correct known imbalances, but it cannot fix bias driven by factors the survey never measured, so any published figure should state what was tested and what was simply assumed.
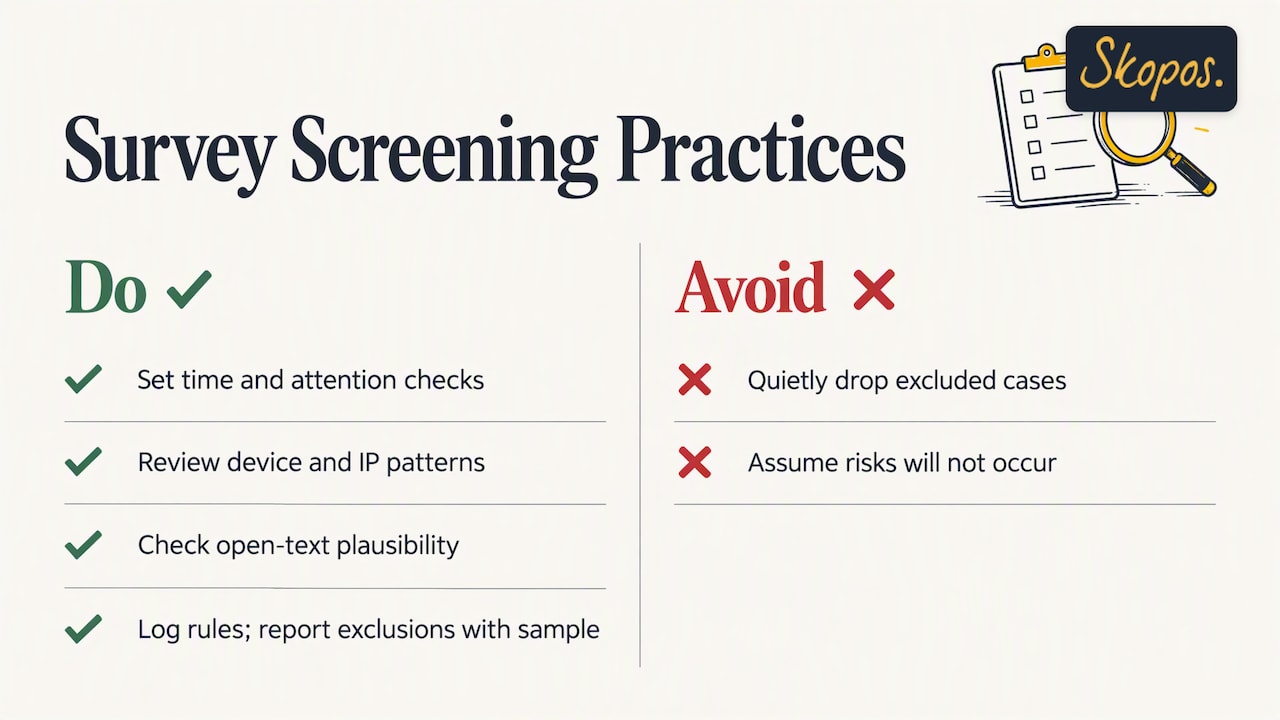
Alongside the long-standing challenge of nonresponse, B2B programmes now face newer integrity risks: automated or bot-driven completions, panel fraud, and open-text answers that look AI-generated rather than genuinely considered. None of these are easy to quantify precisely, but good programmes build in checks rather than hoping they do not occur.
Practical screening includes a minimum time-to-complete threshold, one or two attention-check items placed naturally within the flow, a review of paradata such as device and IP patterns, and a plausibility check on open-text responses. Whatever criteria are used, the exclusion rule should be documented in advance and the number of excluded cases reported alongside the final sample, rather than quietly dropped.
A defensible B2B survey report states the formula used, ideally RR3 or another named AAPOR definition, together with the counts behind each disposition category in the denominator. It names the field period and the number of reminders sent, including whether a last-minute reminder was used. It discloses any incentive offered and states how nonresponse bias was assessed, whether through a randomised design, a follow-up comparison or a documented assumption. Finally, it reports any exclusions applied during data cleaning and the reasoning behind them.
Chasing every possible response eats budget fast, and not every extra point of participation changes the conclusions a client acts on. We favour the handful of tactics with real evidence behind them, paired with senior judgement on where a programme’s specific risks actually lie, over long checklists applied uniformly.
We conduct B2B research as part of our wider B2B and B2C research work, helping turn research into usable answers.
Our work covers:
If your team needs a partner for an upcoming B2B programme, our Foundation, Growth and Strategic options cover projects from a single study through to an ongoing insight relationship. For teams building or verifying a B2B contact list before fielding, guidance on structured prospect-list building is a useful companion step before invitations go out.
A reasonable rate depends heavily on mode, sample and population, which is why methodological reviews resist a single universal figure. For B2B web surveys, a realistic working range depends on the sample and survey design, with telephone and mail typically landing higher.
For most B2B web-based programmes, a higher response rate may be considered strong. The more important question is whether the responses represent the population fairly, since a high rate does not by itself rule out nonresponse bias.
Published benchmarks for CSAT specifically are not consistent enough to quote a single figure with confidence, and definitions vary by channel and trigger point. A transactional CSAT sent immediately after an interaction tends to outperform a standalone emailed survey, following the same mode effects seen in B2B research generally.
Telephone and mail surveys have historically achieved higher response rates than web-only invitations, though long-term tracking by Pew Research shows telephone rates have declined steadily as contact has become harder. The right method depends on budget, timeline and how reachable your sample frame is by each mode.